


The development of a custom solution is the most flexible approach, but can significantly increase labor costs and time of delivery of the result to the customer. Various database management systems also often contain their own tools.
The issue of using solutions that are not tied to a specific data storage method also remains relevant today. One of the most popular is the American system named Tableau: https://www.tableau.com/
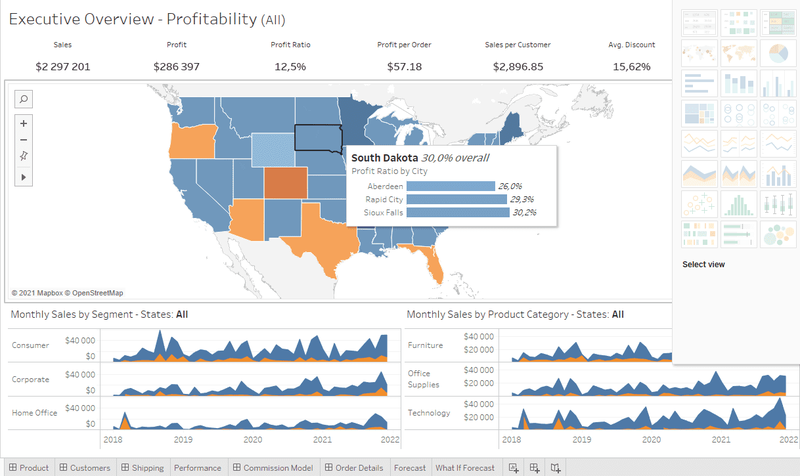
Tableau is a powerful set of tools for working with a mass of heterogeneous data sources, allowing you to build informative visualizations with a minimum of actions.
What is a Tableau
Tableau is a powerful set of tools for working with a mass of heterogeneous data sources, allowing you to build informative visualizations with a minimum of actions.
For convenience, the file structure of the system is built in the form of Workbooks and Sheets, as in Microsoft Excel.
Speaking about the types of data sources, Tableau supports most of the common tools, including CSV files and Excel documents, relational and NoSQL databases, multidimensional OLAP cubes, and others.
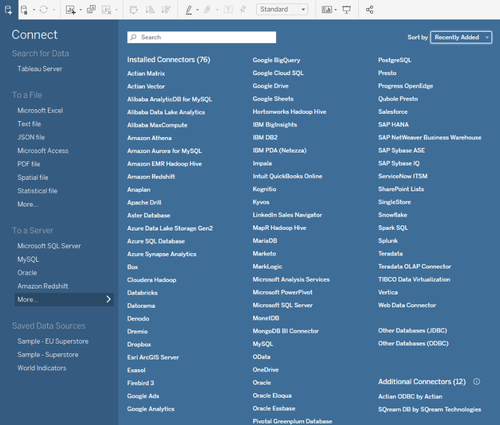
Tableau deployment
For the system deployment, Tableau provides two options:
• placing the system on a dedicated supplier server — Tableau Online,
• on your own server (which has very high system requirements) — Tableau Server,
Both options contain both pros and cons, so the choice must be made based on existing requirements.
The server version, for example, has much more expansion options, such as using the tabcmd built-in command line utility or the Python extension library, TabPy, but it requires additional hardware support costs. The creation of extension functions in the R language is also supported.
In order for the system to learn to “understand” how to build data visualization, a tool is provided for schematically building the data structure according to the principles of the relational model, indicating fields for relationships and types of relationships. There is also the possibility of type casting.
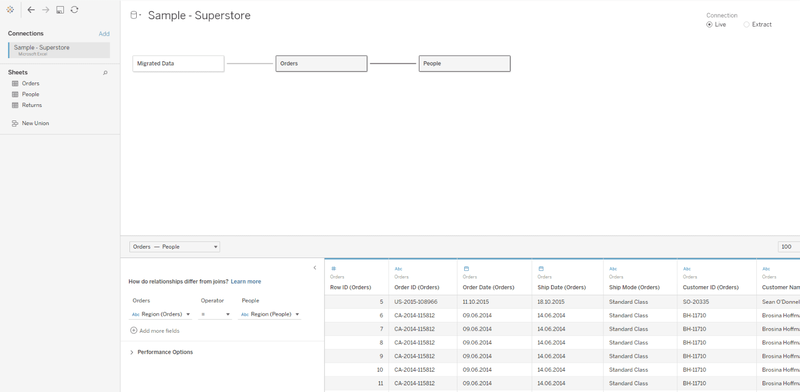
By the way, the set of Tableau solutions provides for the separation of employee functions by roles: an employee can prepare the data structure in Tableau Prep, and build the necessary visualizations in Tableau Desktop (it is also possible to change the structure in it).
It is possible to view prepared visualizations by various changing parameters both in the Desktop version, and on the website/in the mobile application (Android and iOs platforms are supported). The development tools are available for Windows (starting with 8) and OSX (10.14 and higher).
It is also possible to send the downloaded reports by e-mail according to a specified schedule. Unfortunately, only users connected to the system can be included in the newsletter, which implies the purchase of additional accounts for each of the recipients.
Tableau reports
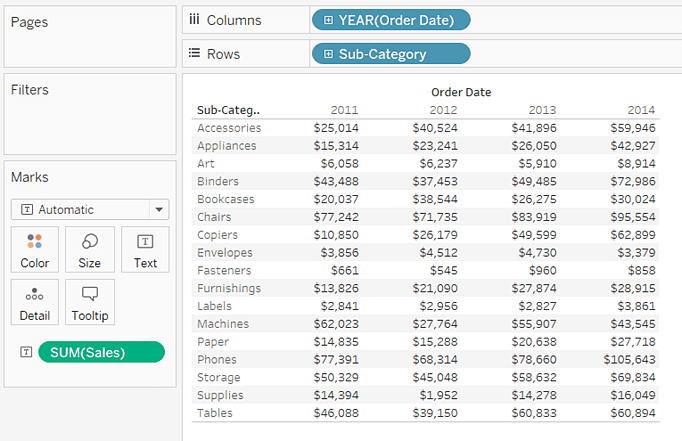
In addition to the graphical representation of the data, of course, the possibility of constructing tabular reports is also provided. Unfortunately, the ways of customizing this view are currently very limited.
Of course, the system would be much less useful if it did not support the integration capabilities with other systems, including those that you are developing.
For this, the solution has a built-in REST API implementation with a detailed description of the methods on the help site:
https://help.tableau.com/current/api/rest_api/en-us/REST/rest_api.htm
For integration with applications implemented in Python, there is also the library named Tableau Server Client (TSC) allowed to use from the company's GitHub.
To ensure the conflict-free operation of several users with the same Workbooks, a file history system is provided.
Tableau disadvantages
One of the main disadvantages of this system is its cost. The license for one user with the rights of the Creator (the least set that is required to start work) is $70 per month billing annually, and for sending out scheduled reports you need to pay $12 dollars per month for each recipient (sold in packages of 100 pieces): https://www.tableau.com/pricing/teams-orgs
Fortunately, to get acquainted with the functions of the solutions, the company offers a free trial period, with the possibility of later transfer of all created data and files to a paid production server: https://www.tableau.com/products/trial
Resume
For beginners, to learn how to work with the system, there is also a set of convenient video lessons offered on all the necessary functions of the program.
If more complex questions arise, there is a community (like some internal StackOverflow), as well as a forum with system developers where you can try to request the development of the missing functionality (although some requests for quite popular and necessary mechanisms have hung for several years): https://community.tableau.com/
Thus, we can use a very powerful tool to easily build visualizations of the data we process. It is best suited for systems where analysts and managers would like to be able to independently build data representations for every taste without the need for changes to the main system.
P.S. Due to the current pandemic situation in the world today, Tableau provides publicly visualized data about COVID-19:


